ANNUAL ENVIRONMENT REPORTS 2011 AND 2012: A CRITICAL REVIEW
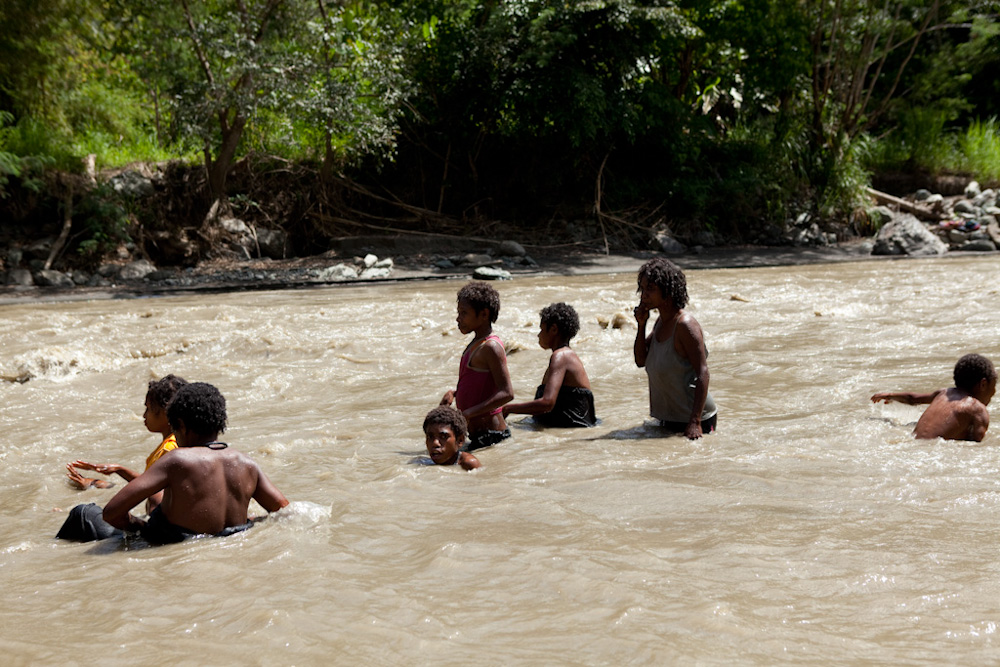
Women and children play in the Watut River, Kapin Village, April 2012 – Jessie Boylan / MPI
This section will focus on the main environmental aspects of the two published Annual Environment Reports for 2011 and 2012 (HVJV, 2012, 2013) which relate to surface water management and monitoring, mine waste management and acid mine drainage.
However, as noted previously, the MMJV have conducted a variety of studies along the Watut River to assess the extent of impacts from operations to date – but the vast majority of these studies remain confidential and are not publicly available. This significantly hampers public transparency as well as the ability to analyse the relevant scientific information and allow a more realistic assessment of the impacts of the Hidden Valley Silver-Gold project to date.
Surface Water Management and Monitoring:
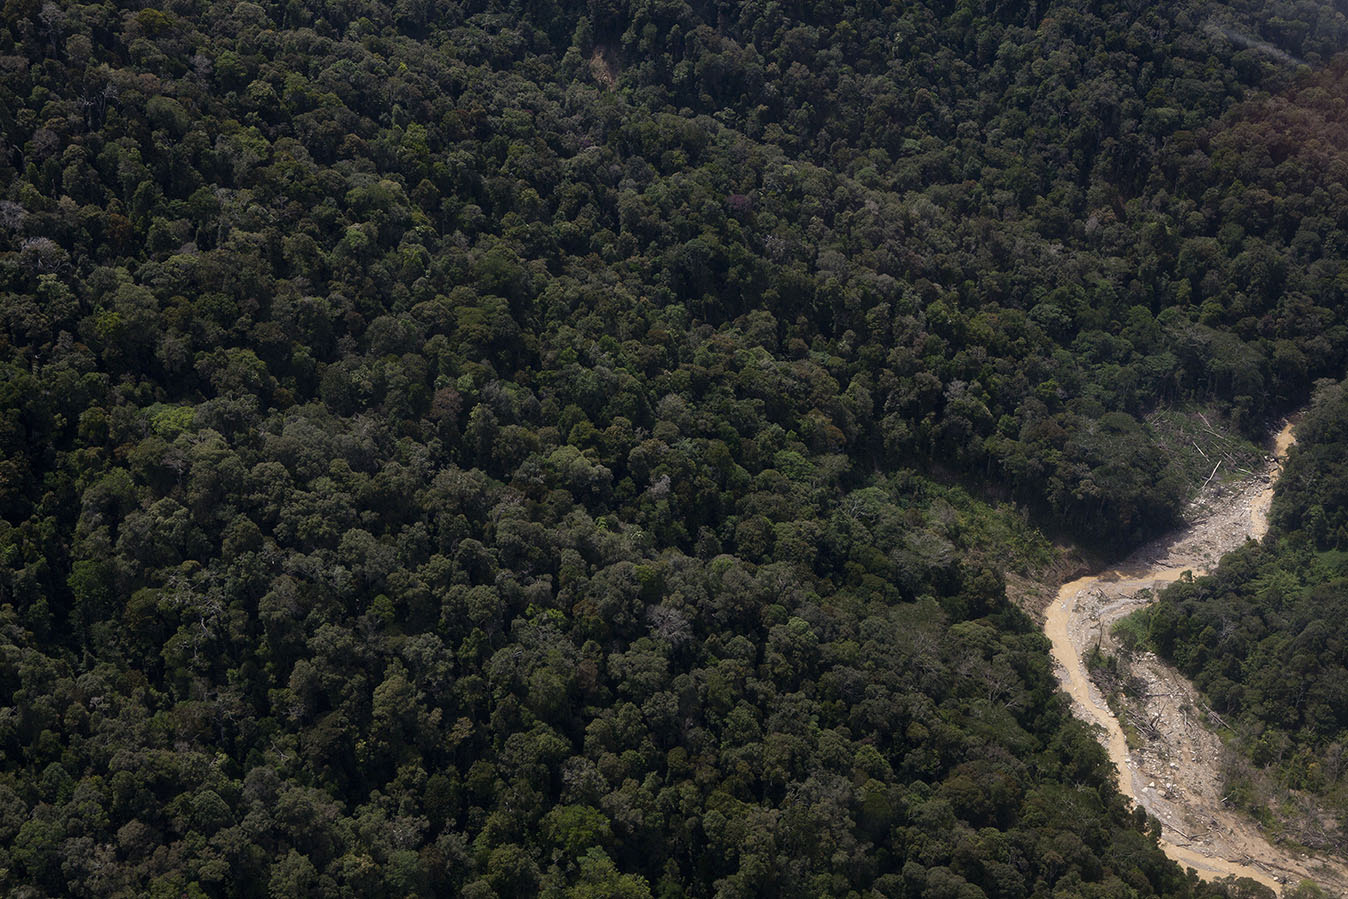
When the Hidden Valley project was approved by the PNG Government, the village of Nauti on the Watut River was designated as the primary downstream compliance point for potential surface water impacts. This point is shown in Figure 4, previously, as the village of Nauti (the first village downstream from Hidden Valley on the Watut River) and is about 15 km downstream from the Hidden Valley project.
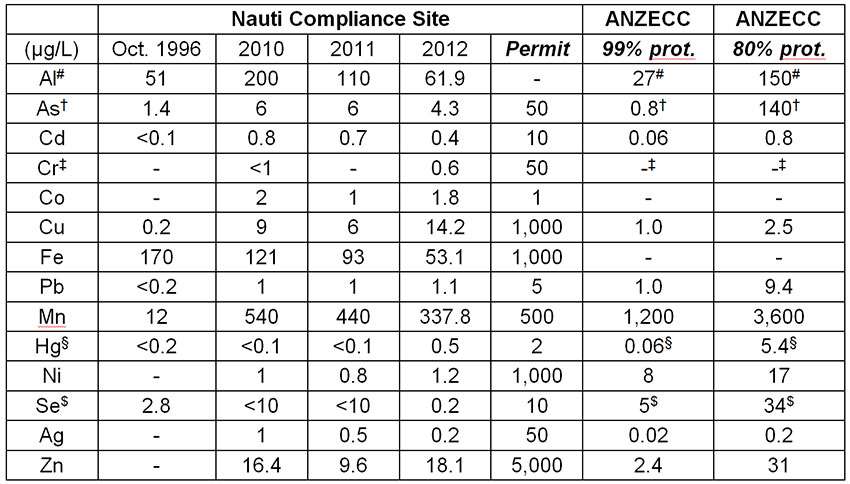
A compilation of annual average water chemistry data from the EIS and recent annual environment reports (2011 and 2012) is given in Tables 5 and 6, using the villages of Hikinangowe, Heyu and Nauti. Hikinangowe is ~4 km downstream of Hidden Valley while Heyu is ~9 km downstream. These tables show that there are discernible changes in water quality at the Nauti compliance point due to Hidden Valley, primarily in suspended sediment (as Total Suspended Sediment or TSS), sulfate (SO4) and metals such as aluminium (Al), arsenic (As), cadmium (Cd), copper (Cu), lead (Pb) and manganese (Mn). The intensity of suspended sediment with respect to rainfall is shown in Figure 12, with detailed As, Cu and zinc (Zn)concentrations during 2012 shown in Figure 13.
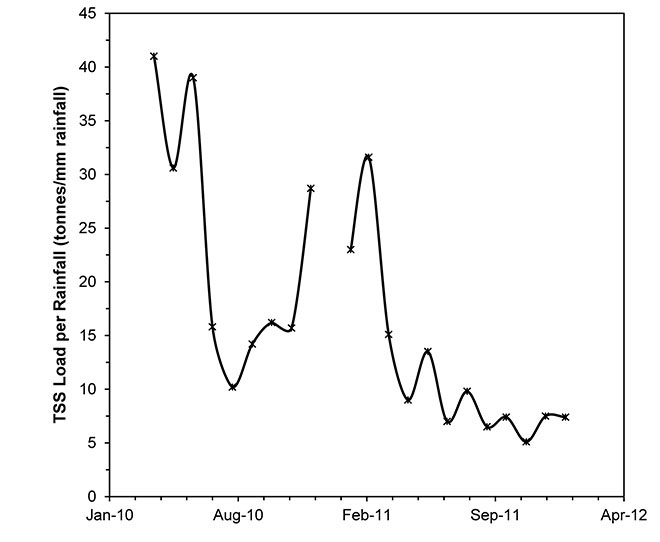
Figure 12: Suspended sediment load downstream of Hidden Valley (redrawn from Figure 17, MMJV, 2012).
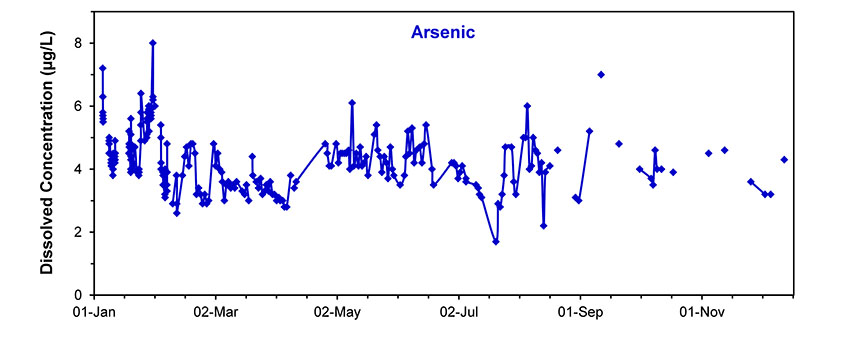
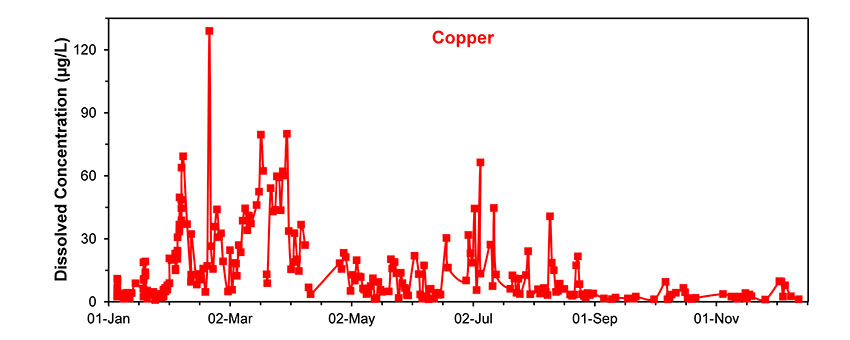
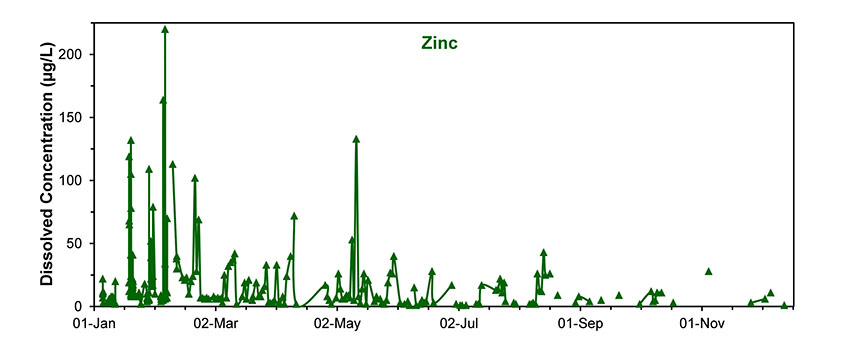
Figure 13: Concentrations of arsenic (As, top), copper (Cu, middle) and Zinc (Zn, bottom) during 2012 at Nauti (adapted from data in MMJV, 2013).
The Nauti permit criteria for suspended sediment in water is stated as no less than a change in 25 turbidity units (or NTU), although the TSS (total suspended sediment) is presented differently in mg/L. In general, a correlation needs to be developed between TSS (in mg/L) and turbidity (in NTU) to demonstrate that the simple measurement of NTU is sufficient to monitor TSS – but the 2011 and 2012 reports fail to present this correlation, limiting the scientific confidence in the presented TSS information in the 2011 and 2012 reports. In addition, although the Hidden Valley permit states <25 NTU change in water quality, this is not referenced to any upstream site or baseline / pre-mining values, making it very difficult to assess compliance. Based on the data in Table 5, suspended sediment appears to have increased about 100-fold in the Watut River at the Nauti compliance point but is decreasing over time while sulfate concentrations have increased 3-4 times and are still increasing.
Finally, in view of the landslides in the broader region and the substantial sediment loads these can deliver to rivers, there is a clear need to distinguish riverine sediment derived from landslides versus those coming from the Hidden Valley project – meaning the correlation between NTU and TSS is crucial to inform ongoing monitoring and assessment.
Although all metals are below the Nauti permit criteria, all except for iron (Fe) show an increase since the late 1990s studies in the 2010 data but generally declining in 2011 and 2012 data. In terms of metals of concern, the most critical are Al, Cu and Zn (and to a lesser extent Mn), based on the magnitudes of the concentrations and relative to ANZECC levels. The higher levels in 2010 are presumably related to discharges of some waters from the mine, such as acidic drainage from some of the waste rock dumps (see later section), since significant discharge volumes of treated tailings water did not occur until early 2012 (see pages 47-48, MMJV, 2013).
The Cu and Zn concentrations over time during 2012 show a highly variable behaviour (ranging from ~1 to 220 µg/L), while As is relatively stable at around 4 µg/L. Based on the 2012 Annual Environment Report it is unclear if the large spikes and variability are due to mine releases or not, but the early 2012 spikes could be related to discharges of treated waters from the tailings dam. Without more detailed site operational information, it is not possible to speculate further, but the magnitudes of the Cu and Zn spikes – reaching some 100 times ANZECC trigger levels to protect 99% of aquatic species – should be of significant concern despite strictly being below the Nauti permit levels.
Importantly, if one compares the Nauti compliance criteria to the relevant Australian standards for freshwater ecosystems (ie. ANZECC & ARMCANZ, 2000) using the high conservation value trigger levels (ie. 99% protection values), all metals are substantially in excess of these values except for Mn. Although it is unclear to what extent that the Australian ANZECC guidelines may be applicable in PNG, there is no clear scientific basis for the criteria presented by the HVJV or PNG Government. It seems reasonable to speculate that the compliance criteria are merely derived from those used for Ok Tedi – especially in the case of Cu and Zn, where the compliance levels are 1,000 and 5,000 µg/L compared to the ANZECC 99% protection values of 1.0 and 2.4 µg/L, respectively (or even the ANZECC 80% protection values of 2.5 and 31 µg/L, respectively). Close to the Hidden Valley mine at Hikinangowe, the average heavy metal levels were clearly capable of causing significant biodiversity impacts, such as Zn at 127 µg/L in 2010, with the levels generally reducing by 2012. The average levels at the Nauti compliance point still remain capable of causing biodiversity impacts in the Upper Watut River if the ANZECC values are instead used for assessment. It must also be remembered that there were substantial peaks in heavy metal concentrations which are much higher than the yearly averages – increasing risks of biodiversity impacts along the Upper Watut River if these were to re-occur.
The 2012 Annual Environment Report, perhaps surprisingly, acknowledges that: “An ongoing assessment of the aquatic biology of the Watut River has indicated that populations of fish and prawns in the upper Watut collapsed during 2007 to 2009. It is likely that most of this impact was associated with physical sedimentation. To date there is little evidence populations of fish and prawns are recovering despite lower sediment levels, however, populations of diatoms, which are at the base of the food chain for fish, are recovering” (page 56, HVJV, 2013).
An alternative approach to water quality criteria would be to ensure the Hidden Valley project does not cause unacceptable deviations away from background or baseline water quality. This could be done either using an upstream reference site (ie. in the Upper Watut River just above the impacted project area) or at the Nauti compliance point as a baseline value plus an allowable variation. In any case, there is a clear need to improve the regulation of water quality compliance for the Hidden Valley project and its actual and potential impacts on the Watut River.
At present, there appears to be no data published by the Hidden Valley project on the metals concentrations of sediments in the Watut River, and this remains a major weakness of the environmental monitoring regime. Sediment concentrations are crucial to understand the full picture of environmental risks and impacts.
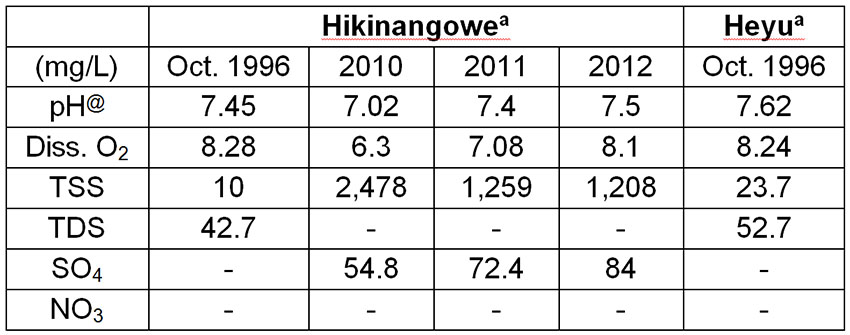
Table 5: Average water chemistry parameters at the Hikinangowe, Heyu and Nauti monitoring points in the Upper Watut River (compiled from Powell & Powell, 2000; Enesar, 2004; HVJV, 2012, 2013)

- Notes: The Powell & Powell (2000) study, as provided in the EIS, uses names of Ikenenuwe and Aiyu; @pH has no formal units; Diss. O2 – dissolved oxygen; TSS – total suspended solids (ie. suspended sediment); TDS – total dissolved solids (ie. dissolved salts); SO4 – sulfate; NO3 – nitrate. †NTU is turbidity units, a surrogate for TSS.
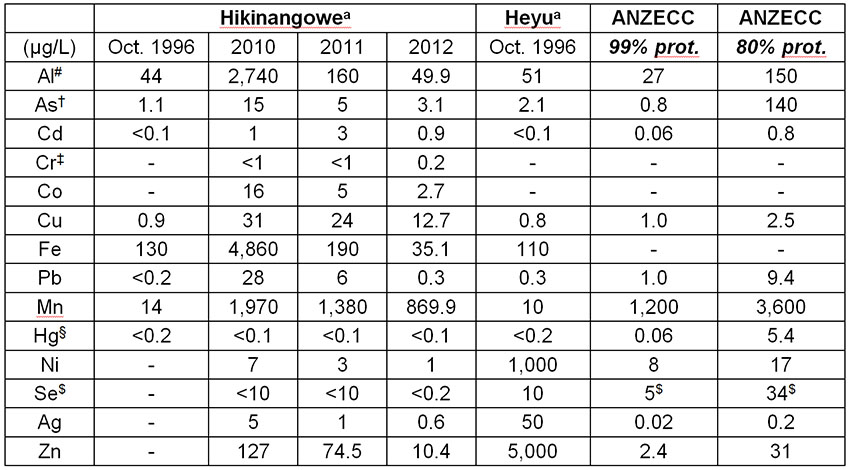
Table 6: Average heavy metals in water at the Nauti compliance point and along the Watut River (compiled from Powell & Powell, 2000; Enesar, 2004; HVJV, 2012, 2013)